Anthropogenic greenhouse gas emissions are the primary cause of climate change which has both direct impacts and exacerbating effects on many, if not all, of the aforementioned ocean stressors. Specifically, we aim to target three categories of emissions:
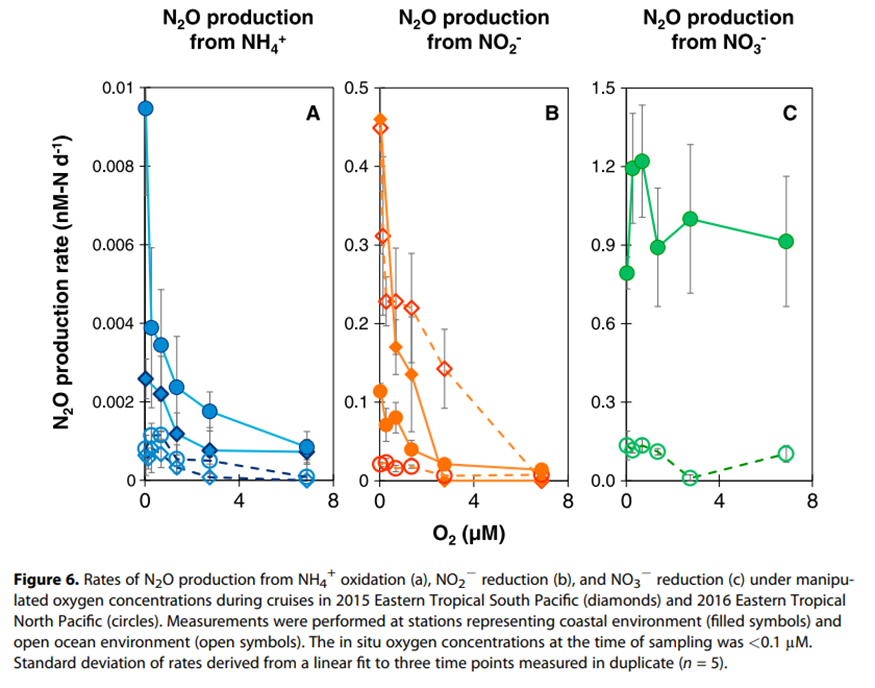
Oxygen minimum zones (OMZs) are estimated to contribute to around 20% of the ocean’s nitrous oxide emissions. This is because low oxygen conditions are associated with increased N2O production during denitrification and, to a lesser extent, ammonium oxidation, and nitrification. N2O production is reduced/inhibited in the presence of higher oxygen concentrations.
Methane is a potent greenhouse gas which has contributed to 25% of the current atmospheric
warming (Rosentreter et al., 2021) and is around 25 times more effective at trapping heat than carbon
dioxide. Methane emissions from aquatic ecosystems and wetlands have been largely
underestimated and may even surpass direct anthropogenic methane emissions (Rosentreter et al.,
2021). Human impacts on aquatic ecosystems, namely increases in eutrophication and HAB events,
have been identified as a major driver of methane emissions from water sources (Fernandez et al.,
2020; Rosentreter et al., 2021) . It is forecast that eutrophication will increase methane emissions from
freshwater ecosystems by anything from 20-100% by 2050 (Downing et al., 2021) . The forecast 30-
90% increase over the next hundred years would be equivalent to 18-33% of the annual carbon
dioxide produced by burning fossil fuels (Beaulieu, DelSontro & Downing, 2019) .
By remediating nutrient pollution and HABs even just to maintain current aquatic ecosystem methane
emission levels could avoid climate-change-related costs of up to $24 trillion (Downing et al., 2021) .
Reducing nutrient pollution and excess organic matter in these aquatic ecosystems would thus offer
quick wins in the fight against greenhouse gases and global warming (Rosentreter et al., 2021).
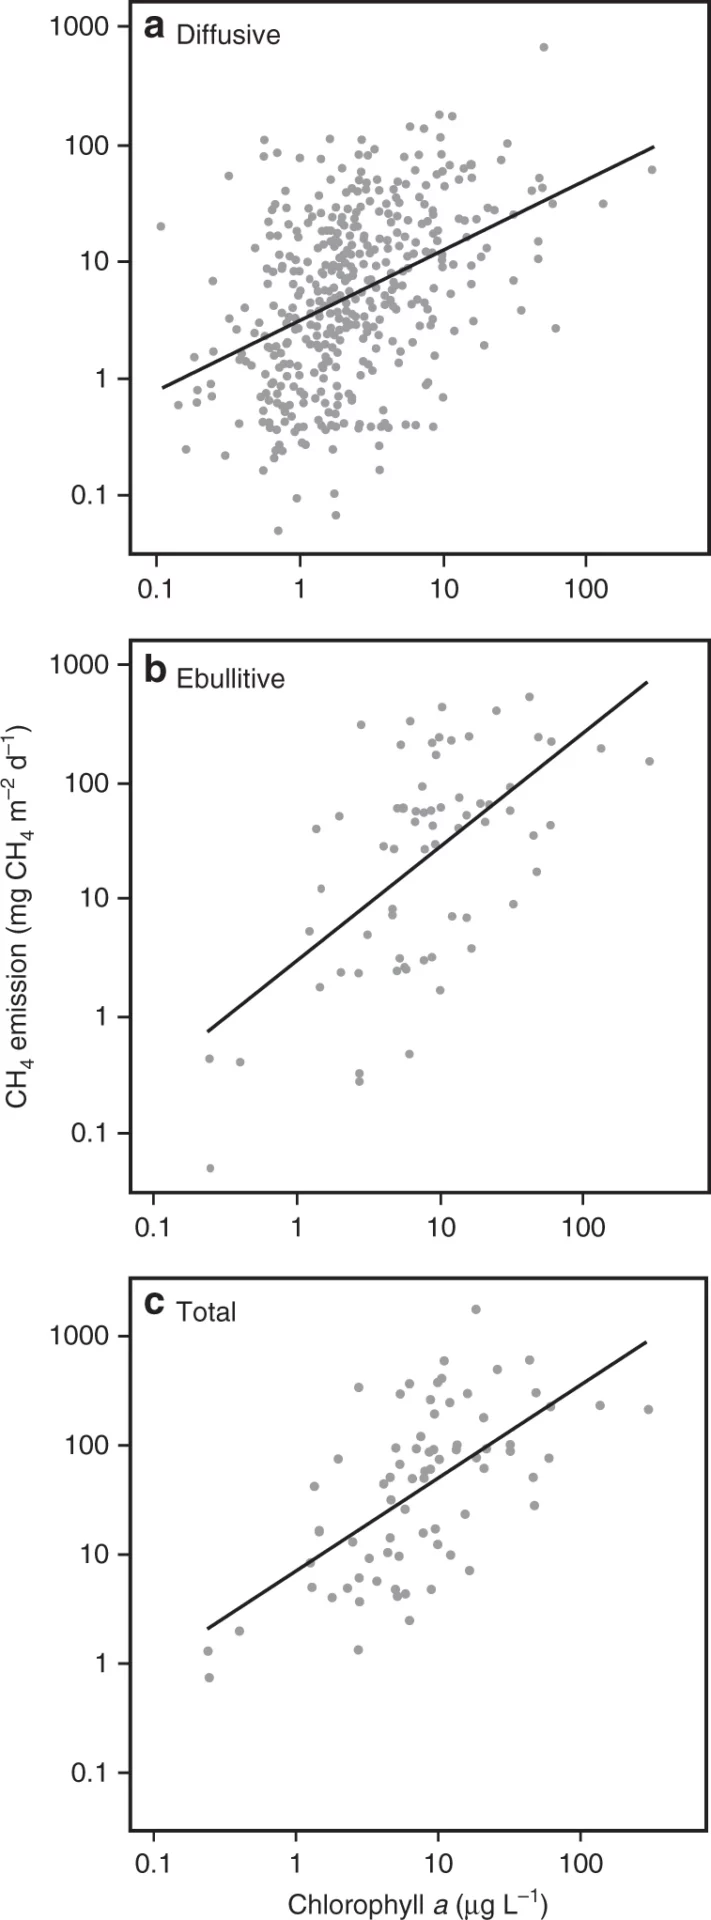
Relationships between CH4 flux rates and productivity measured as the concentration of chlorophyll a (chla) in the water column of lakes and impoundments. Solid lines are regression relationships. a Diffusive flux is the flux rate from the water to the atmosphere driven by super-saturation in the water column. b Ebullitive flux is that emitted by the formation of bubbles transported to the surface. c Total flux is the sum of both diffusive and ebullitive flux. Note: panel a shows only the relationship between diffusive CH4 flux and chla concentration, whereas the predictive model for diffusive flux includes both a lake size and chla effect [Table 3 from Beaulieu, J.J., DelSontro, T. & Downing, J.A. Eutrophication will increase methane emissions from lakes and impoundments during the 21st century. Nat Commun 10, 1375 (2019). https://doi.org/10.1038/s41467-019-09100-5)]
Nitrous oxide is even more potent – around 298 times the warming potency of carbon dioxide. It is
also an ozone-depleting gas which, unlike CFCs, remains unregulated (Arévalo-Martínez et al., 2015) .
Oxygen minimum zones (OMZs) are estimated to contribute 20% of the ocean’s nitrous oxide
emissions (Ji et al., 2018). This is because low oxygen conditions are associated with increased N2O
production during denitrification, ammonium oxidation, and nitrification (Arévalo-Martínez et al., 2015;
Ji et al., 2018; Naqvi et al., 2010). Reducing ocean deoxygenation and oxygenating hypoxic areas
could therefore go a long way in reducing the ocean’s N20 emissions (see Figure below).
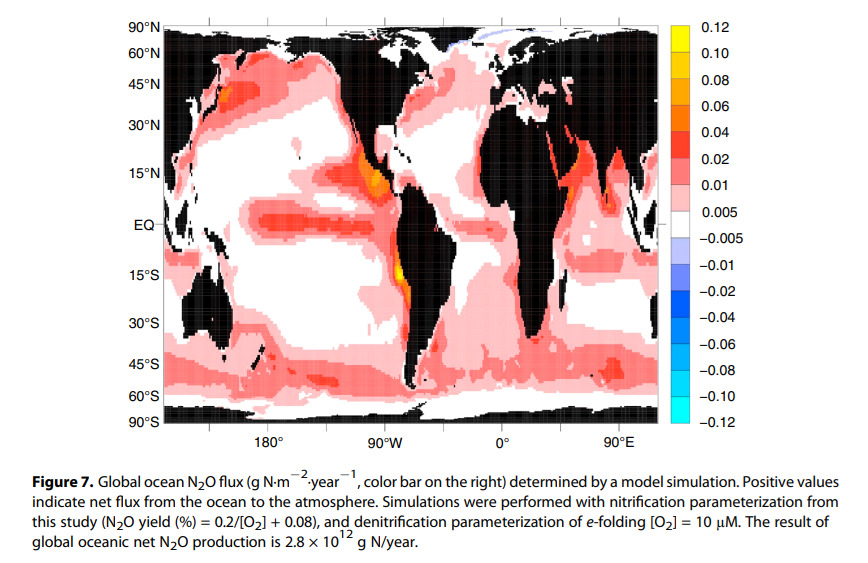
Figure 9. Global ocean N20 flux determined by a model simulation which quantified the effects of oxygen concentration on N2O production. The colour bar indicates flux (g N/m2/year) where positive values are net flux of N20 from the ocean to the atmosphere. The global oceanic N20 flux was estimated to be 2.8 Tg N/year. Source: Ji et al., 2018.
Here we present high-resolution surface measurements and vertical profiles of nitrous oxide that
include the highest reported nitrous oxide concentrations in marine surface waters, suggesting that
there is a hotspot of nitrous oxide emissions in high-productivity upwelling ecosystems along the
Peruvian coast. We estimate that off Peru, the extremely high nitrous oxide supersaturations we
observed drive a massive efflux of 0.2–0.9 Tg of nitrogen emitted as nitrous oxide per year, equivalent
to 5–22% of previous estimates of global marine nitrous oxide emissions. Nutrient and gene
abundance data suggest that coupled nitrification–denitrification in the upper oxygen minimum zone
and transport of resulting nitrous oxide to the surface by upwelling lead to the high nitrous oxide
concentrations. Our estimate of nitrous oxide emissions from the Peruvian coast surpasses values
from similar, highly productive areas.
For example, Lake Erie, which is notoriously plagued by HABs, is emitting methane and nitrous oxide
at a rate equivalent to 500,000 metric tons of carbon dioxide per year - that’s 125 times the capacity of
the largest direct carbon capture machine in the world (Fernandez et al., 2020) . The elimination of
methane emissions from Lake Erie HABs would therefore dwarf all Direct Carbon Capture efficacies
to date.
...
The ocean has absorbed a large proportion of anthropogenic CO2 emissions which, once absorbed, forms carbonic acid which reduces ocean pH and disrupts the solubility of calcium carbonates which are vital for the survival of calcifying organisms.